
Zapmap monitors the prices of charging on the public network and reports on the PAYG prices charged by the Top 10* rapid charging networks below. The prices are updated on a monthly basis.
What’s the price of charging an electric car on the Top 10 rapid charging networks?
The price to charge an electric car on one of the Top 10 rapid charging networks in June 2025 varies between 52p/kWh and 88p/kWh. You can see the prices charged by the top 10 public rapid charging networks in the infographic below.
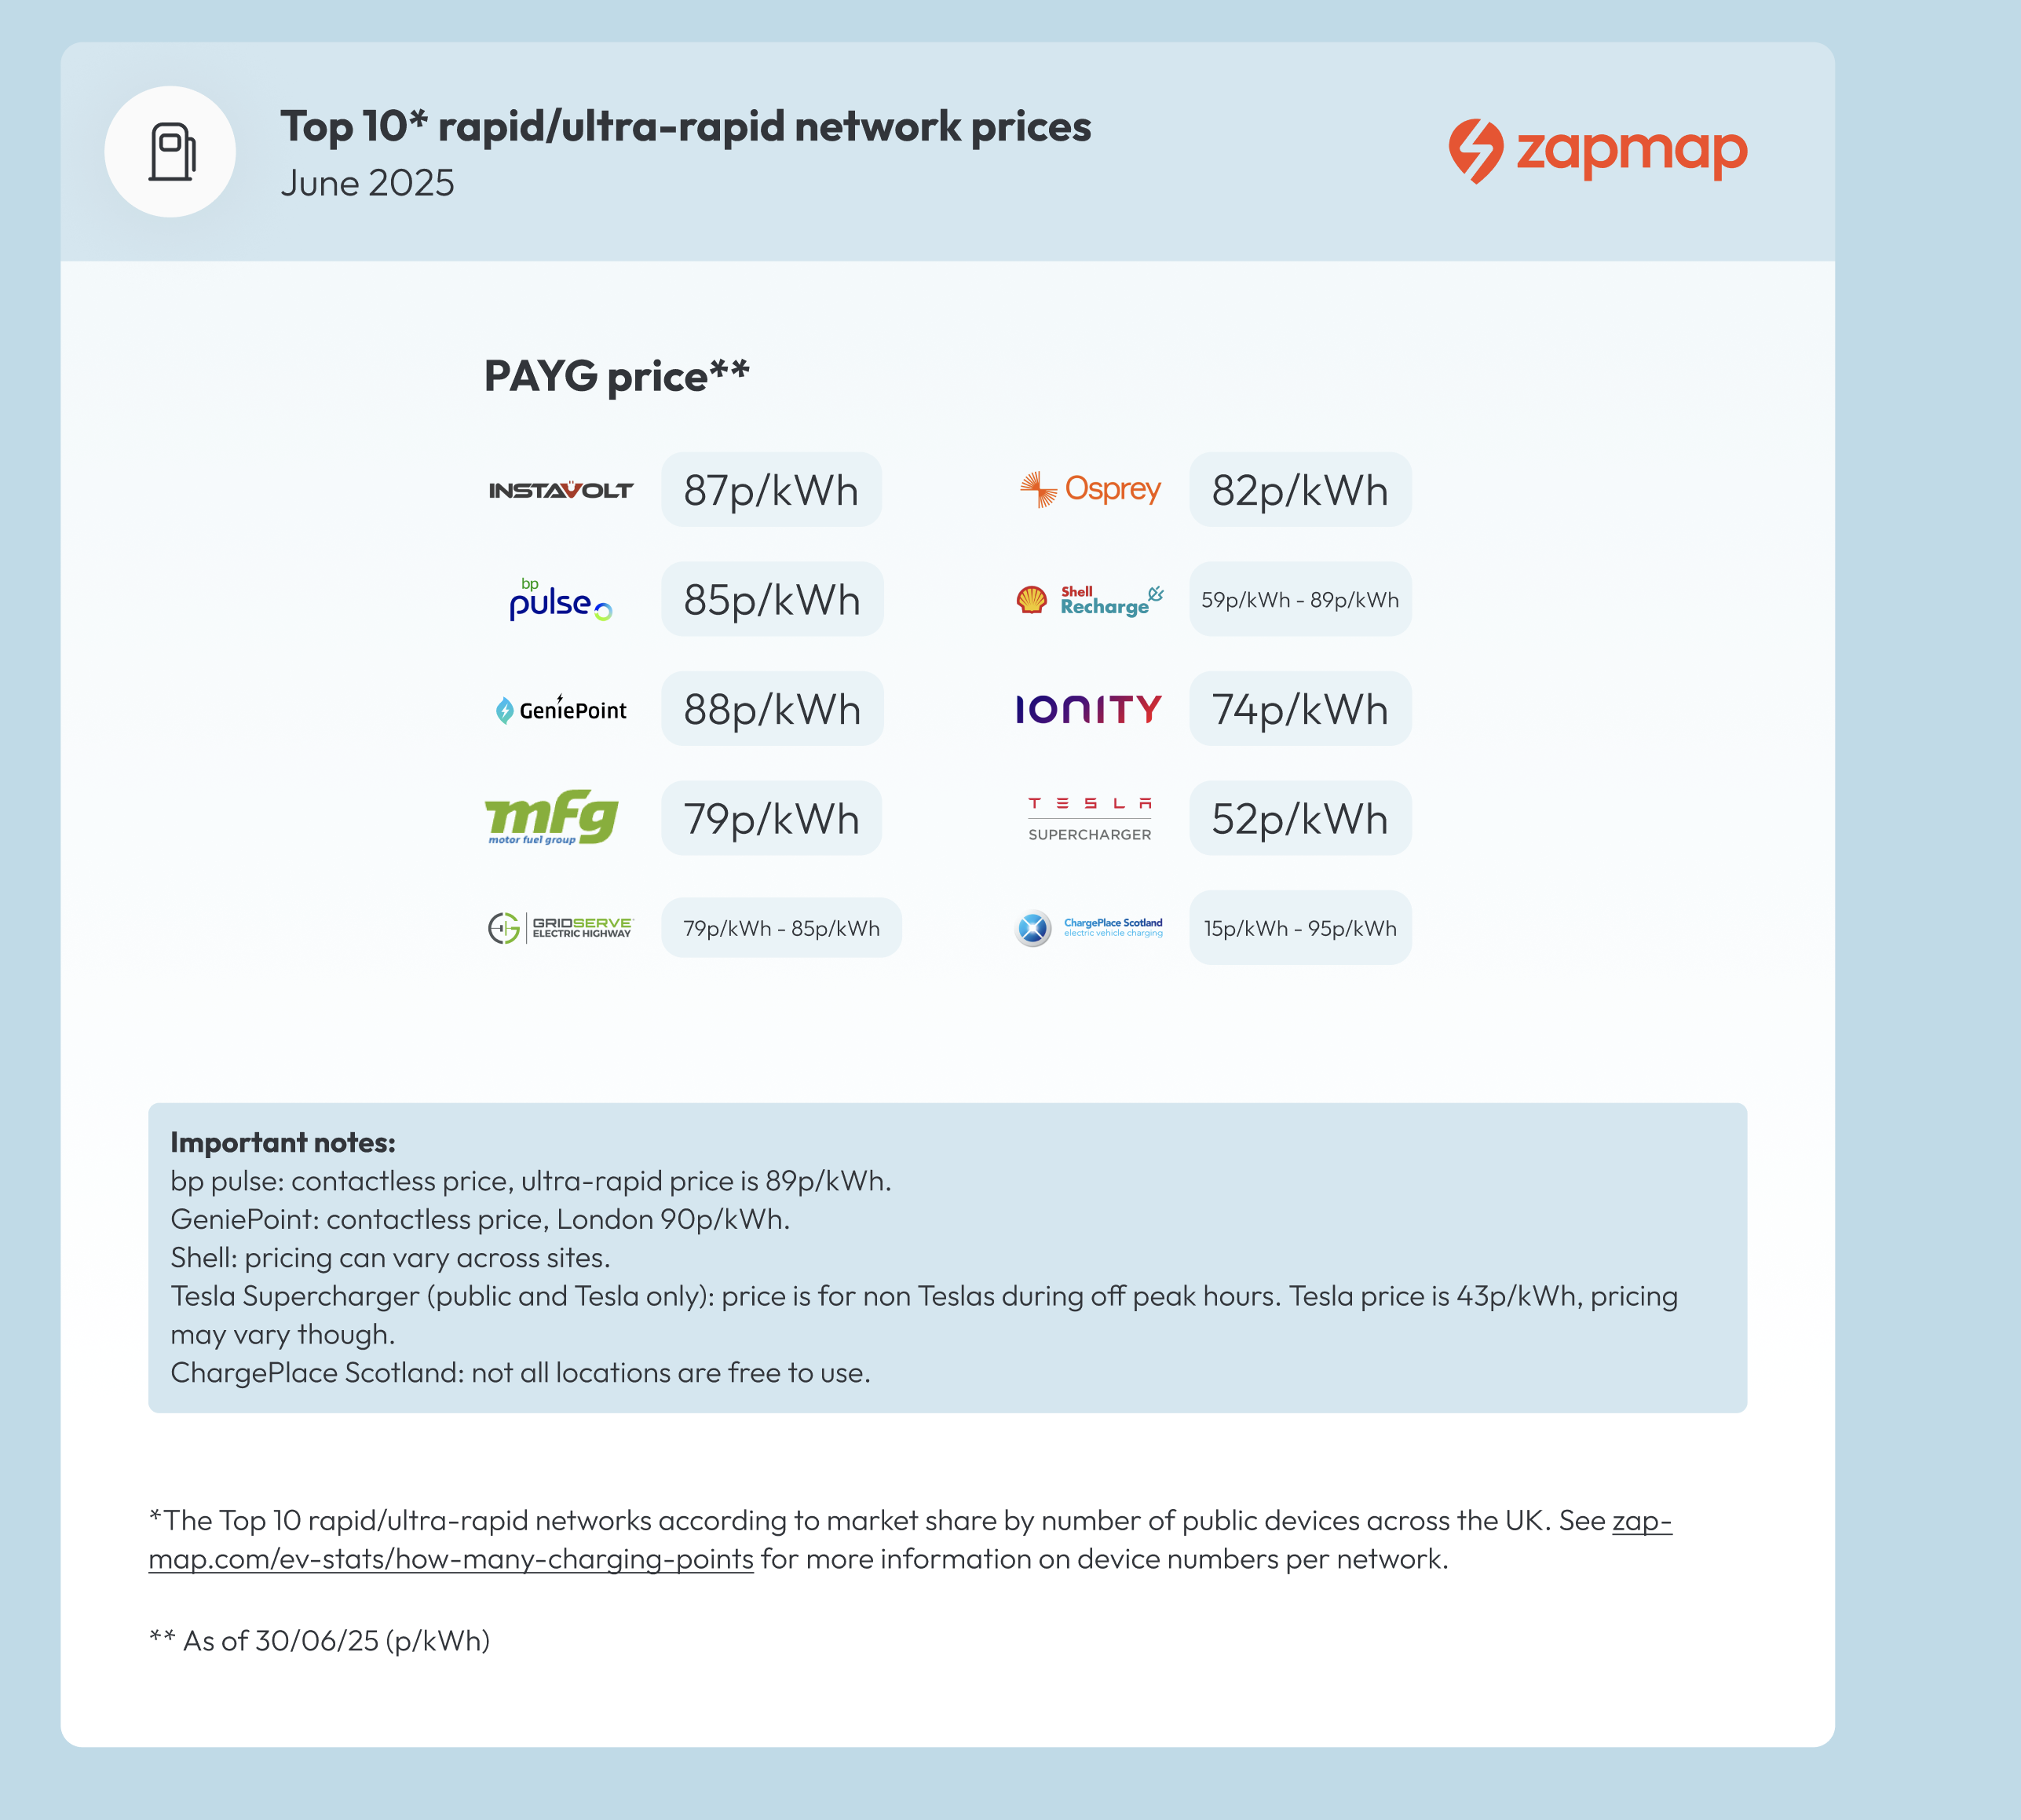
Of the Top 10 charge point networks, GeniePoint currently has the highest network wide price at 88p/kWh. At present, the cheapest network is Tesla where the majority of their open locations charge 52p/kWh during daytime hours.
Whilst the Top 10 networks account for around 75% of all 50kW+ rapid / ultra-rapid chargers, there are many other networks which provide rapid / ultra-rapid charging across the country, many of whom provide cheaper charging. These include Sainsbury’s Smart Charge (72p/kWh), Fastned (74p/kWh), Believ (66p/kWh).
It should be noted that the prices provided above are the PAYG prices, ie. the price EV drivers can pay at a charge point network without a membership or a special deal.
With a 33% increase in the number of rapid / ultra rapid chargers over the past 12 months, it is expected that there will be increasing number of price promotions available in order to attract EV drivers, and there is already evidence that this is happening - good news for EV drivers!
How are rapid charging prices changing over time?
To simplify the pricing landscape and track the changes in the prices on the public network, Zapmap produces the Zapmap Price Index from the data collected to drive the Zapmap app. The Zapmap Price Index, updated monthly, shows how the weighted average PAYG price to charge an electric car on the public charging network varies over time.
Other data that Zapmap makes available in the public domain, and updates on a regular basis includes tracking EV charging infrastructure profile, new EV registrations and growth, Zapmap Price Index or best networks for EV charging.
If you are interested in more detailed data and insights on the EV charging market for your business, we have much more available, find out more or get in touch with the Zapmap Insights team.
Please note that third parties can use this data provided the source is clearly attributed to Zapmap, any graphs include the Zapmap logo, and a link is added back to www.zapmap.com in the body of the article. The data must be strictly copied and updated manually, no automated data collection can be applied in any form. The data can only be published in its original state and without any modifications.


