
The price to charge an electric vehicle (EV) on the public charging network can vary substantially across type of charger and network.
With the significant increase in number and range of charger locations, we expect to see promotions and competitive pressures bringing down the overall cost of public charging which is good news for EV drivers.
Through the data collected to drive the Zapmap app, Zapmap tracks almost two million charge sessions each month and the latest charge point operator PAYG ("pay as you go") prices to provide an independent picture of the price paid by EV drivers across the public charging network. Updated on a monthly basis, the Zapmap Price Index shows the difference in prices paid depending on the type of charger and will also track how this is changing over time.
What is the average price of charging an electric car on the public charging network?
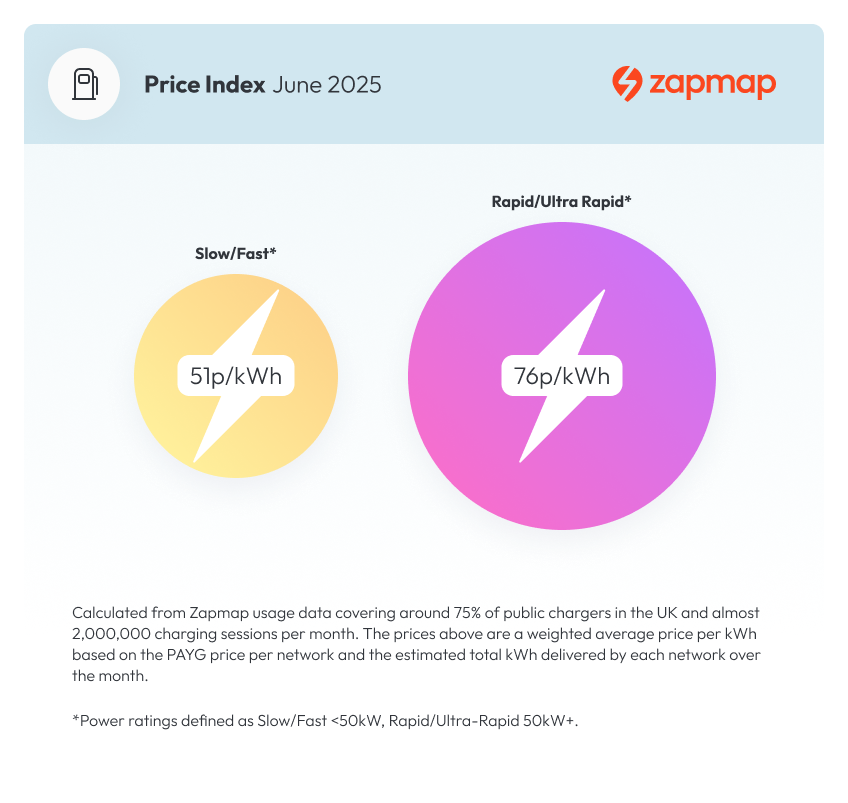
The weighted average PAYG price to charge an electric car on the public charging network in June 2025 was 51p/kWh on slow/fast chargers and 76p/kWh for rapid/ultra-rapid chargers.
Using an average efficiency EV* this equates to 15 pence per mile and 23 pence per mile respectively.
The PAYG price is the price EV drivers can pay at a charge point network without a membership or a special deal.
Some charge point operators will offer time-bound, location specific or partner specific promotional deals, and so for many EV drivers the actual amount they pay will be lower than the PAYG price. Thus we should expect that the actual average price paid for EV charging is lower than the prices above.
In addition, whilst the weighted average rapid/ultra-rapid PAYG price is 76p/kWh, many networks across the country provide cheaper PAYG charging these include Sainsbury’s Smart Charge (72p/kWh), Fastned (74p/kWh), Believ (66p/kWh).
The latest PAYG price for the top 10 rapid/ultra-rapid charge point operators, which cover around 75% of all chargers, can be seen on our rapid/ultra-rapid pricing page.
Prices for other charge point operators can be seen in this guide covering public EV charging networks.
How are prices to charge an electric car changing over time?
Zapmap analysis shows that the average weighted PAYG price to charge an electric car has remained stable since last year both for slow/fast charge points - typically on-street chargers or destination chargers - as well as rapid/ultra-rapid EV charge points typically used for en-route charging.
Zapmap analysis shows that after a period of rising prices, the average weighted PAYG price to charge has remained at or just below 80p/kWh over the past year.
The price per kWh at fast/slow devices has remained steady over the same time period.
The chart below shows how the prices have changed over the last 12 months.
Please note that from April 2025 following Tesla provision of a live data feed to Zapmap, the charging sessions conducted on all Tesla Public charge points have been added into the analysis. An average PAYG price for non Tesla drivers has been applied to these sessions. This has resulted in an overall drop in the weighted price for Rapid/Ultra-rapid 50kW+ devices from April 2025.
How do electric car charging prices compare to refuelling a petrol or diesel car?
Despite the increase in public EV charging prices over the few years, electric car drivers are mostly still in a better position than ICE drivers who have to fill up at the pumps. Typically, an EV driver will only charge on the most expensive rapid or ultra-rapid chargers for a fraction of the time.
Many EV drivers charge at home for most of their energy needs, with the energy price cap currently sitting at around 27p/kWh, and might also have the option to install solar panels, or take advantage of a lower price off-peak tariff (around 8p/kWh) and so reduce the cost of charging their electric car further.
The infographic below looks at how charging costs may differ with three different EV driver profiles.
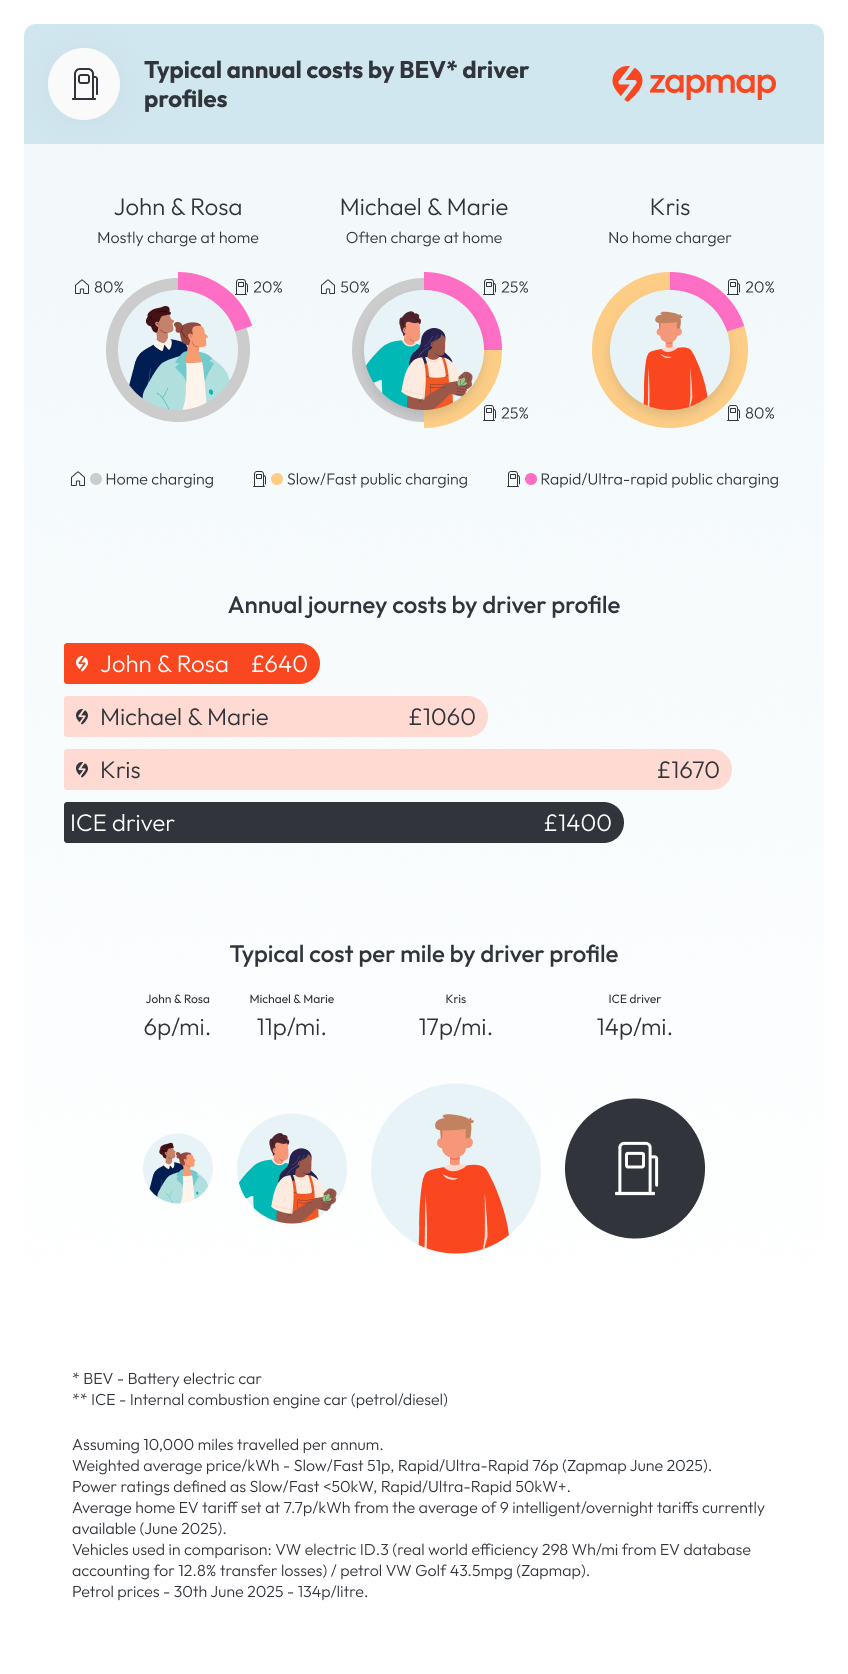
First, John and Rosa primarily charge their EV at home. Second, Michael and Marie do about half of their charging at home, but top up when they go to the supermarket and charge up at motorway service stations when on longer journeys. As typical of many EV drivers, both couples have a specific EV home tariff, costing them on average 8p/kWh.
Third, Kris is entirely reliant on public charging. He is able to use a slow lamppost charger to charge on most days, but when he’s on longer road trips visiting relatives he uses rapid chargers at a charging hub.
Most of the drivers in the above profiles enjoy savings from driving their EV compared to ICE vehicles. John and Rosa save £760, whereas Michael and Marie save £300 per year compared to refuelling an ICE vehicle.
While Kris doesn't currently save on charging his EV versus refuelling the equivalent petrol car, he does benefit from savings on car tax, servicing and maintenance costs. See more about the other benefits of driving an electric car. He also may charge on one of the lower priced PAYG rapid/ultra-rapid networks, or benefit from off-peak pricing or a loyalty deal.
Overall, most EV drivers use a mix of charging, as above. An electric car remains a good choice for low running costs during these uncertain times, and is of course far better for the environment in terms of its impact on climate change and air quality.
Using the Journey Cost Calculator, Home Charging Calculator or Public Charging Cost Calculator, you can compare the cost of refuelling a petrol or diesel vehicle with the cost of charging an EV at home or in public, allowing you to see how much you could save between different vehicles on specific journeys.
Other data that Zapmap makes available and updates on a regular basis includes tracking EV charging infrastructure profile, new EV registrations and growth or best networks for EV charging.
If you are interested in more detailed data and insights on the EV charging market for your business, we have much more available, find out more or get in touch with the Zapmap Insights team.https://www.zapmap.com/ev-stats/how-many-charging-points
Please note that third parties can use this data provided the source is clearly attributed to Zapmap, any graphs include the Zapmap logo, and a link is added back to https://www.zapmap.com in the body of the article. The data must be strictly copied and updated manually, no automated data collection can be applied in any form. The data can only published in its original state and without any modifications.


